图7
然后创建一个新工程。点击“new”,创建一个新的project,在“title”给文件命名,“project home”选择project文件夹,“data directory”选择data文件夹。“data source”选择”wos“,其他选项保持默认值,点击“save”保存。如图8。
Then create a new project. Click "new" to create a new project, name the file in "title", select the project folder for "project home", and select the data folder for "data directory". Select "wos" for "data source", keep the default values for other options, click "save" to save. As shown in Figure 8.

图8
设置“time slicing”选择自己筛选的文献的年份,“node types”选择“reference”,做文献的共被引分析。如图9。
Set "time slicing" to select the year of the documents you filter, and select "reference" for "node types" to do the co-citation analysis of the documents. As shown in Figure 9.

图9
点击绿色按钮“go”,左下方区域显示已经开始计算。运算结束后,跳出一个新窗口,点击“visualize”查看计算结果。如图10。
Click the green button "go", the lower left area shows that the calculation has started. After the calculation is over, a new window will pop up, click "visualize" to view the calculation result. As shown in Figure 10.

图10
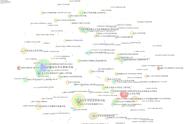
运算结果,左边是被引文献出现的频数、中心度、年份。(中心度大于0.1的,在右边的图形中会显示为红点,表明意义较大)。如图11。
The calculation result, on the left is the frequency, centrality, and year of the cited documents. (If the center degree is greater than 0.1, it will be displayed as a red dot in the graph on the right, indicating greater significance). As shown in Figure 11在控制面板,根据自己的需要进行调整。节点大小代表文献的被引次数。连线的颜色代表首次共被引的时间。如图12。
In the control panel, adjust according to your needs. The node size represents the number of times the document has been cited. The color of the link represents the time of the first co-citation. As shown in Figure 12.


