分享兴趣,传播快乐,增长见闻,留下美好!亲爱的您,这里是LearningYard学苑。
今天小编为大家带来Origin绘图(3)-柱状图的绘制,欢迎您的用心访问!本期推文时长大约2分钟,请您耐心阅读。
Share interest, spread happiness, increase knowledge, and leave beautiful. Dear, this is the Learing Yard Academy!
Today, the editor brings the Origin drawing(3)-Drawing of histogram. Welcome to visit! This tweet usually takes about 2 minutes to read. Please read patiently.
条形图的绘制
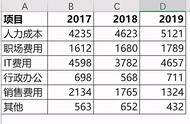
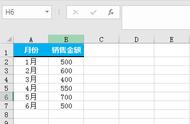
同一组数据使用不同的条形图,所呈现的效果也不同。今天要用到的数据如下:
The same group of data uses different bar Charts, and the results are different. The data to be used today are as follows:

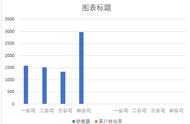
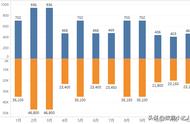
簇状柱形图

簇状柱形图可以看出不同月份各个电子产品的销售额数量。适合分析对比组内的各个数据。
The cluster bar chart shows the number of sales of each electronic product in different months. It is suitable for analyzing various data in the comparison group.
堆积柱形图