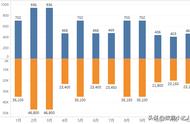
堆积柱状图可以看到每种电子设备在不同月份的占比,同时还可以直观地看到每个月份电子设备销售总额的趋势。
The stacked bar chart allows you to see the percentage of each type of electronic device in different months, as well as visualize the trend of total electronic device sales for each month.
百分比堆积柱形图

百分比堆积柱形图不但能看出每个类别的具体值,还可体现同一条件下每个类别的占比。
The percentage stacked bar chart not only shows the specific value of each category, but also the percentage of each category in the same condition.
堆积条形图的绘制
图表特点:
优点:可以直观看出每个分类下的不同系列数据的大小,可以比较不同分类的数据总量大小。
缺点:不适用于系列太多的场景。
Chart characteristics.
Advantages: You can visualize the size of different series of data under each category, and you can compare the size of total data in different categories.
Disadvantages: Not suitable for scenarios with too many series.
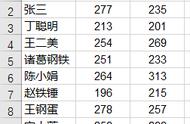
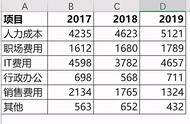
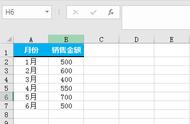
1、输入数据
1.Input Data

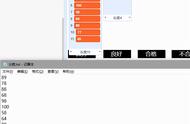
2、选择要绘制的条形图,这里绘制的是【堆积柱状图】
2.select the bar graph to be drawn, here is drawn [stacked bar graph]

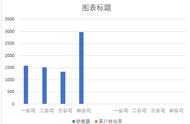
3、创建后,我们就会得到相关图形。
3. After creation, we will get relevant figures.