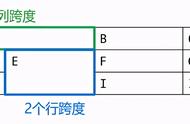
表格table上的斜线,一般用在首行首列上,这个东西大家肯定都不陌生,在excel打印文档时我们时常都能碰到,那么在html中如何给table添加这个效果呢?
我总结了以下几种方法:

1、最最最简单的做法
直接去找公司的UI,让她做一张图片,作为背景图片放到这里,然后撑满就可以了。是不是很简单!!!
2、相当简单的做法
其实了解css3的朋友,一看到这个效果,脑子中瞬间出现的就是transform这个属性,是的,这个确实可以,也很简单,就是有一个问题要注意浏览器的兼容性问题,大家心里要要时刻保持着危机意识(IE还存在呢),如果你们公司的要求是只兼容chrome,那么,这个方法很适合你。
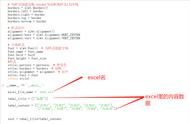
3、十分简单的做法
.biaoTou {
       border-top: 200px #199fff solid; /*上边框宽度等于表格第一行行高*/
       border-left: 200px #ff8838 solid; /*左边框宽度等于表格第一行第一格宽度*/
}
<td width="200">
    <div class="biaoTou">

    </div>
</td>
这种方法也很简单,按照上面的格式写下来就好了。但是这种写法有个明显的问题:这种其实就是利用两种颜色的不同的border划分表头的斜线的,斜线两边的颜色不能相同,如果是做一些促销活动之类的表格时可以用这种方法。但是如果我们需要斜线两边的颜色一样时,这种做法是不适用的,慎用。
4、很简单的做法
这种效果其实还可以用css3的另一个新的标签canvas。将其作为画布画一条斜线是一种十分简单的做法,就不详细解释了,但是也有一个问题,就是老生常谈的兼容性问题了,如果只是兼容chrome,你想怎么办都行(为什么我们公司一直要考虑可恶的IE,我也想只做兼容谷歌的项目啊)。
5、不简单的做法
那就是js做法了
<!DOCTYPE html>
<HTML>
<HEAD>
<TITLE>斜线表头</TITLE>
<meta http-equiv="content-type" content="text/html; charset=utf-8">
</HEAD>

<body leftmargin=0 topmargin=0>
    <br>
    <div height="300">header</div>
    <hr>
    <TABLE border=0 bgcolor="000000" cellspacing="1" width=400
        style="margin-left: 100px;">
        <TR bgcolor="FFFFFF">
            <TD width="111" height="52"><table width="100%" height="100%"
                    border="0" cellpadding="0" cellspacing="0">
                    <tr>
                        <td id="td1"></td>
                        <td>成绩</td>
                    </tr>
                    <tr>
                        <td>姓名</td>
                        <td id="td2"></td>
                    </tr>
                </table></TD>
            <TD width="81">数学</TD>
            <TD width="96">英语</TD>
            <TD width="99">C语言</TD>
        </TR>
        <TR bgcolor="FFFFFF">
            <TD>张三</TD>
            <TD>55</TD>
            <TD>66</TD>
            <TD>77</TD>
        </TR>
        <TR bgcolor="FFFFFF">
            <TD>李四</TD>
            <TD>99</TD>
            <TD>68</TD>
            <TD>71</TD>
        </TR>
        <TR bgcolor="FFFFFF">
            <TD>王五</TD>
            <TD>33</TD>
            <TD>44</TD>
            <TD>55</TD>
        </TR>
    </TABLE>
    <script type="text/javascript">
        function a(x, y, color) {
            document
                    .write("<img border='0' style='position:absolute; left:"
                              (x)
                              "; top:"
                              (y)
                              ";background-color: "
                              color
                              "' src='px.gif' width=1 height=1>")
        }
        function getTop(tdobj) {
            vParent = tdobj.offsetParent;
            t = tdobj.offsetTop;
            while (vParent.tagName.toUpperCase() != "BODY") {
                t  = vParent.offsetTop;
                vParentvParent = vParent.offsetParent;
            }
            return t;
        }

        function getLeft(tdobj) {
            vParent = tdobj.offsetParent;
            t = tdobj.offsetLeft;
            while (vParent.tagName.toUpperCase() != "BODY") {
                t  = vParent.offsetLeft;
                vParentvParent = vParent.offsetParent;
            }
            return t;
        }
        function line(x1, y1, x2, y2, color) {
            var tmp
            if (x1 >= x2) {
                tmp = x1;
                x1 = x2;
                x2 = tmp;
                tmp = y1;
                y1 = y2;
                y2 = tmp;
            }
            for ( var i = x1; i <= x2; i  ) {
                x = i;
                y = (y2 - y1) / (x2 - x1) * (x - x1)   y1;
                a(x, y, color);
            }
        }
        //line(1,1,100,100,"000000");
        line(getLeft(td1), getTop(td1), getLeft(td1)   td1.offsetWidth,
                getTop(td1)   td1.offsetHeight, '#000000');
        line(getLeft(td2), getTop(td2), getLeft(td2)   td2.offsetWidth,
                getTop(td2)   td2.offsetHeight, '#000000');
    </script>
</BODY>
</HTML>
需jq库
<!doctype html>
<html>
<head>
<title>new document</title>
<meta http-equiv="Content-Type" content="text/html; charset=utf-8" />
<script src="Scripts/jquery.js"></script>
<style type="text/css">
table td {
border: 1px solid #666;
padding: 1px;
}
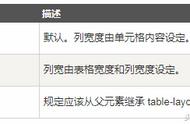
.np {
padding: 0;
}
.container {
width: 100%;
height: 100%;
position: relative;
left: 0;
top: 0;
margin: 0;
}
.bias_line {
position: absolute;
}
.left_text {
position: absolute;
left: 2px;
bottom: 2px;
}
.right_text {
position: absolute;
top: 2px;
right: 2px;
text-align: right;
}
</style>
</head>
<body>
<table style="width: 100%;">
<tr>
<td style="width:50%; height:50px;" class="np">
<div class="container">
<div class="left_text">项目</div>
<div class="right_text">日期</div>
<div class="bias_line"></div>
</div>
</td>
<td>sss</td>
</tr>
</table>
<script type="text/javascript">
//表格添加斜线
$(document).ready(function () {
var arr = [],
fx = function (t, b, c, d) {
return c * t / d b;
}, i = 0;
var height = $(".container").parent().height();
var width = $(".container").parent().width();
var color = $(".container").parent().css("border-left-color");
for (var i = 0; i < width; i ) {
arr.push('<div style="width:1px;height:1px;font-size:0;background-color:' color ';position:absolute;left:' (i - 1) 'px;top:' (Math.ceil(fx(i, 0, height, width))) 'px"><\/div>');
}
$(".bias_line").html(arr.join(''));
});
</script>
</body>
</html>
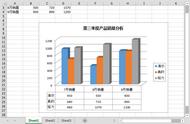
说起html的编辑那才真叫个让人头痛,前段时间就因为一个html的斜线绘制法,找遍了百度搜索引擎,把我搞得头痛万分,最后终于是解决了,没想到就是那么几句话,可是我却找了整整几天的时间,太费事了。不说那么多了,还是看看我这总结的<v:line>在html中的作用吧,可别小视了它,它的作用大着呢。如果你能控制好的话还可以做出非常好看的折线统计图来,今天就分享给大家吧,这么好的一串代码:
首先你要在见面的开头<html>标签中加入对象: xmlns:v="urn:schemas-microsoft-com:vml"。大家一看便知晓,是一个microsoft组件标签。
其次我们要重新定义一个样式:v\:* { BEHAVIOR: url(#default#VML); color: #FF0000; }
最后我们利用<v:line>中的form,to属性来操作折线的起始和结束的位置,如:<v:line from="0,0" to="50,50"></v:line>。
<html xmlns:v="urn:schemas-microsoft-com:vml">
<style>v\:*{behavior:url(#defualt#vml);display:inline-block}</style>
<html xmlns:v="urn:schemas-microsoft-com:vml">
<head>
<title>vml</title>
<style>v\: * {behavior:url(#default#vml);display:inline-block}</style>
</head>
<body>
<v:oval style="width:50px;height:50px" fillcolor="red"></v:oval>
</body>
</html>
,