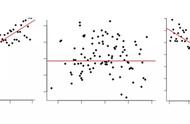
首先绘制散点图,横轴是克拉数,纵轴是价格(正相关)
qplot(carat,price,data=dat)

绘制散点图,对x,y 值取log,可以看出钻石的克拉数和价格是呈现正相关的。
qplot(log(carat),log(price),data=dat)

颜色、大小、性状和其他属性的设置
qplot(carat,price,data=dat,colour=color)

# 后期应用ggplot() 函数后,可以更加自由的绘制各种组合图形
qplot(carat,price,data=dat,geom=c("point","smooth"))# 添加了一条拟合曲线