#1
斯塔克尔伯格模型
在古诺模型和伯特兰德模型里,竞争厂商在市场上的地位是平等的,因而它们的行为是相似的。而且,它们的决策是同时的。当企业甲在作决策时,它并不知道企业乙的决策。但事实上,在有些市场,竞争厂商之间的地位并不是对称的,市场地位的不对称引起了决策次序的不对称,通常,小企业先观察到大企业的行为,再决定自己的对策。德国经济学家斯塔克尔伯格建立的模型就反映了这种不对称的竞争。
在斯塔克尔伯格的寡头理论中,提出了将寡头厂商的角色定位为“领导者”与“追随者”的分析范式。一般来说,古诺模型中互为追随者的两个厂商势均力敌。而斯塔克尔伯格的寡头厂商模型中,一个是实力雄厚的领导者,一个是实力相对较弱的追随者。
该模型的基本假定条件是,在一个寡头行业中有两个厂商,他们生产相同的产品,其中,一个寡头厂商是处于支配地位的领导者,另一个是寡头厂商的追随者;另外,与古诺模型一样,每个厂商的决策变量都是产量,即每个厂商都会选择自己的最优产量来实现利润最大化。
In the Cournot model and Bertrand model, the status of competitors in the market is equal, so their behavior is similar. Moreover, their decisions are simultaneous. When enterprise A is making a decision, it does not know the decision of enterprise B. But in fact, in some markets, the positions of competing manufacturers are not symmetrical. The asymmetry of market position causes asymmetry in the decision-making sequence. Usually, small companies first observe the behavior of large companies before deciding their own countermeasures. The model built by the German economist Stackelberg reflects this asymmetric competition.
In Stackelberg's oligarchic theory, an analytical paradigm that positions oligarchs as "leaders" and "followers" is proposed. Generally speaking, the two vendors that are followers of each other in the Cournot model are evenly matched. In Stackelberg's model of oligarchs, one is a strong leader and the other is a relatively weak follower.
The basic assumption of the model is that there are two manufacturers in an oligopoly industry, and they produce the same product. Among them, one oligarch Like the Nobel model, each firm’s decision variable is output, that is, each firm will choose its own optimal output to maximize profits.
#1
matlab.数值分析
前提假设:该供应链为制造商领导的供应链,以后悔敏感系数为例,探究其变化对批发价格的影响。
Prerequisite: The supply chain is a manufacturer-led supply chain. Take the sensitivity coefficient of regret as an example to explore the impact of its changes on wholesale prices.
MATLAB代码分析
syms r k a g
*syms在matlab中的作用是定义符号变量,意思为创建符号变量r、k、a、g*
*The role of syms in matlab is to define symbolic variables, meaning to create symbolic variables r, k, a, g*
k=0.667;a=0.7;g=1.7;
*输入给变量的赋值*
*Input to variable assignment*
d=0:0.01:1;
*假设图形每隔0.01单位取一个点、可根据自己的需要设置*
*Assuming that the graph takes one point every 0.01 unit, you can set it according to your needs*
Wml3=[ ];
*设定一个空集合*
*Set an empty collection*
Wml4=[ ];
*再设定一个空集合,因为后面画两个函数的图形,所以设定两个空集合,拿来装运行后每个函数的值*
*Set an empty set again, because the graphs of two functions are drawn later, so set two empty sets to load and run the value of each function*
for r=0:0.01:1
*套用一个for循环函数,这里求r为自变量,r变化带给函数的变化趋势,所以假设r每隔0.01取一次值*
*Apply a for loop function, where r is the independent variable, and the change of r brings the change trend of the function, so suppose r takes a value every 0.01*
Wml1=0.5*(-(k*r*(a*g-1)-1) (a a*k*(g-1)-1)*k*r);
*输入函数1*
*Input function 1*
Wml2=0.5*(a a*k*(g-1)-k*r*(a*g-1) (a a*k*(g-1)-1)*k*r);
*输入函数2*
*Input function 2*
Wml3=[Wml3 Wml1];
*将求得的函数1的值,装入刚刚设定的空集合Wml3*
*Put the obtained value of function 1 into the empty set Wml3 just set*
Wml4=[Wml4 Wml2];
*将求得的函数2的值,装入刚刚设定的空集合Wml4*
*Put the obtained value of function 2 into the empty set Wml4 just set*
end
*循环结束*
*End of loop*
figure()
*建立图形*
*Create graphics*
plot(d,Wml3,'b-x',d,Wml4,'r- ')
*用plot函数绘制两个二维图形,plot(X,Y,LineSpec)*
*Use the plot function to draw two two-dimensional graphics, plot (X, Y, LineSpec)*
*图形样式格式设置如下*
*The graphic style format is set as follows*

xlabel('\lambda');
*给x轴命名*
*Name the x-axis*
*\alpha,\beta,\gamma,\delta,\lambda,\phi就是实现希腊字母输出的*
*\alpha,\beta,\gamma,\delta,\lambda,\phi is the output of Greek letters*
ylabel('w');
*给y轴命名*
*Name the y-axis*
legend('w_1^{ML}','w_2^{ML}')
*插入图例,图形1叫什么,图形2叫什么*
*Insert a legend, what is figure 1 called, and what is figure 2 called*
*上下标的输入*
*Input of subscripts and subscripts*
*Matlab中上标用^(指数),下标用_(下划线)*
*Matlab uses ^ (index) for superscripts and _ (underscore) for subscripts*
*调用方式为:^{任意字符},_{任意字符}*
*The calling method is: ^{any character},_{any character}*
gtext({'w_1^{ML}';'w_2^{ML}'})
*可以看到图像窗口中将出现一条十字准线。在需要标注的地方点击鼠标,即可在图片上标记要标记的内容*
*You can see that a crosshair will appear in the image window. Click the mouse on the place that needs to be marked, you can mark the content to be marked on the picture*
*gtext('y= sin x','FontSize',14)*可以更改字体大小*
*gtext('y= sin x','FontSize', 14)*The font size can be changed*
% hold off
*hool on 和hold off的差别*
*hold on在当前坐标系中画了一幅图,再画另一幅图时,原来的图还在,与新图都能被看到*
*hold on draws a picture in the current coordinate system, and then draws another picture, the original picture is still there, and the new picture can be seen*
*hold off在当前坐标系中画了一幅图,再画另一幅图时,原来的图就看不到了,在轴上绘制的是新图*
*hold off draw a picture in the current coordinate system, and then draw another picture, the original picture is not visible, and the new picture is drawn on the axis*
% pause
*程序暂停*
完整输入的代码如下图所示:

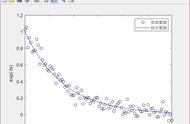
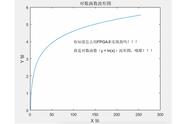
运行结果如下图所示:

参考资料:谷歌翻译
本文由LearningYard学苑原创,如有侵权,请联系删除。
,