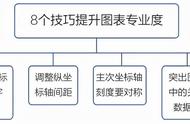
第2步,打开定义折线图的对话框,选择“图形->旧对话框->折线图”弹出对话框,选择“多线”图形,“图表中的数据为”选项组中选择“个案组摘要”选项,单击“定义”按钮弹出如下图所示对话框。
Step 2: Open the dialog box for defining line chart, select "Graphic-> Old Dialog Box-> Line Chart" to pop up the dialog box, select "Multi-line" graph, select "Case Group Summary" option in the option group of "Data in Chart is", and click "Definition" button to pop up the dialog box shown in the following figure.


第3步,选择分类变量,将“年份”作为分类变量,从左边的变量列表中选择“年份”,添加到“类别轴”中,每种邮电业务指标是一条折线,于是从左边的变量列表中选择变量“指标分类”添加到“折线定义依据”框中。
Step 3: Select the classification variable, take "year" as the classification variable, select "year" from the variable list on the left, and add it to the "category axis". Each post and telecommunications business index is a broken line, so select the variable "index classification" from the variable list on the left and add it to the box of "broken line definition basis".
第4步,确定折线表示的方式和统计量,在“折线表示”选项组中给出确定折线代表的统计量,选择“其他统计(例如平均值)”单选项,激活下面的变量框,将“指标值”移入其中,操作方式与条形图类似。
Step 4, determine the way and statistics represented by broken lines, give the statistics represented by broken lines in the option group of "broken line representation", select the single option of "other statistics (such as average value)", activate the variable box below, and move "index value" into it. The operation mode is similar to that of bar chart.