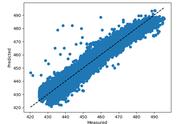
得到预测数据后,可以发现预测效果与真实情况存在偏差。首先预测结果中存在少量负值,这与实际情况中渗透率为正不符。为了更加直观地展示预测结果与真实值的分布情况,我画出了测试集的真实值与对应的预测值之差,以此观察偏差效果,并计算平均绝对误差。
sns.distplot((y_test-predictions),bins=50)
#y_test-predictions概率分布
predictions_all=lr.predict(x)
# predictions.reshape(-1)
print("平均误差:",(sum(abs(y-predictions_all)))/len(predictions_all)) #计算平均误差
OUTPUT:

图3 y_test-predictions
由图3可知,y_test-predictions的值主要分布在0附近的范围,大致呈现正态分布,表明预测结果有效,但仍有偏差较大的数据存在。计算平均误差得到平均误差为187.77,由于数据集中渗透率数据主要集中在0-1000,故误差较大。
最后完成将预测值输入到Excel表格中的任务。
def insert_pdt(predictions_all): #将预测数据插入到excel表格

wb=openpyxl.load_workbook(r'G:\Loong_2021\bd_fhw\data.xlsx')

 sheetNames = wb.sheetnames

 print(sheetNames)

 sheet1 = wb.worksheets[0]

 for i in range(len(predictions_all)):

 sheet1.cell(i 2, 24).value=predictions_all[i] #excel中单元格为X2开始,即第24列,第2行

 wb.save(r'G:\Loong_2021\bd_fhw\data.xlsx')


insert_pdt(predictions_all)
,